 Arbor
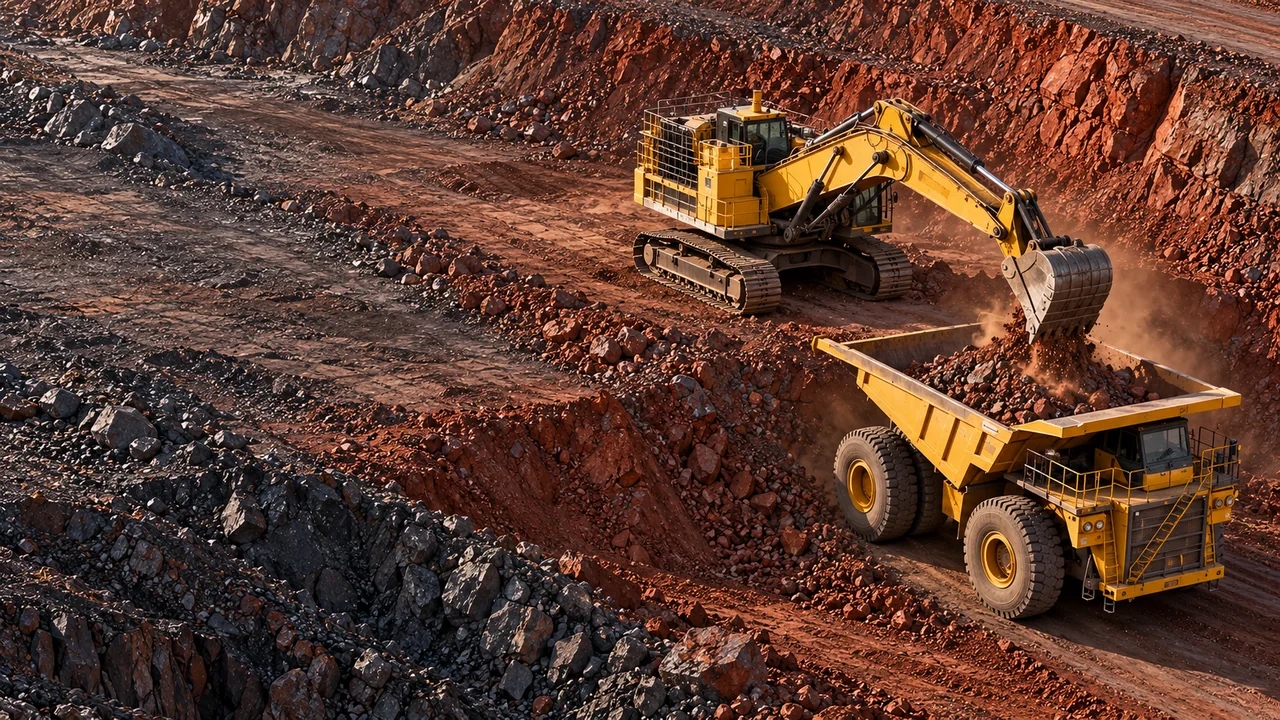
Trace the source of every truckload
Understand where the ore came from
From model and blast block to bucket and truckload
Build an accountable chain of ore movement

Mining solution · Grade Control Copilot
AI-native ore grade management
Reduce dilution and ore loss, stabilise grade
Highlights
From model and blast block to bucket and truckload
Build an accountable chain of ore movement
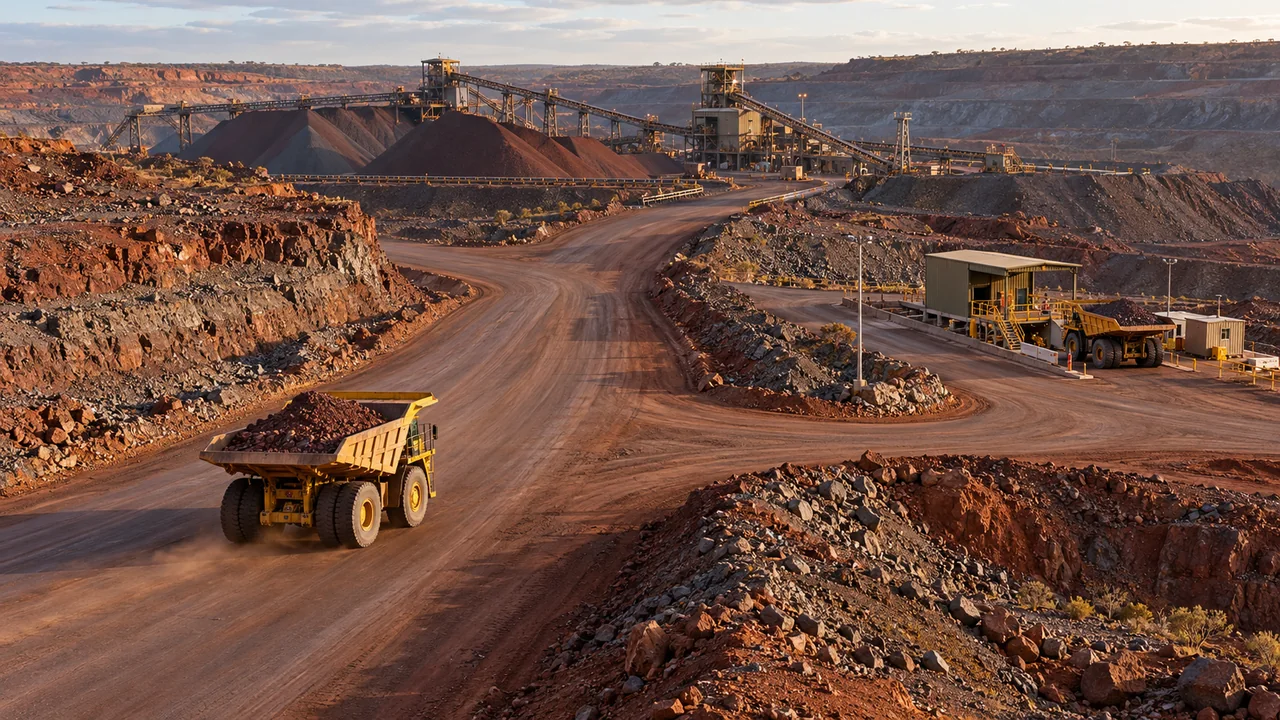
Turn grade uncertainty and testing costs
Into explainable routing recommendations
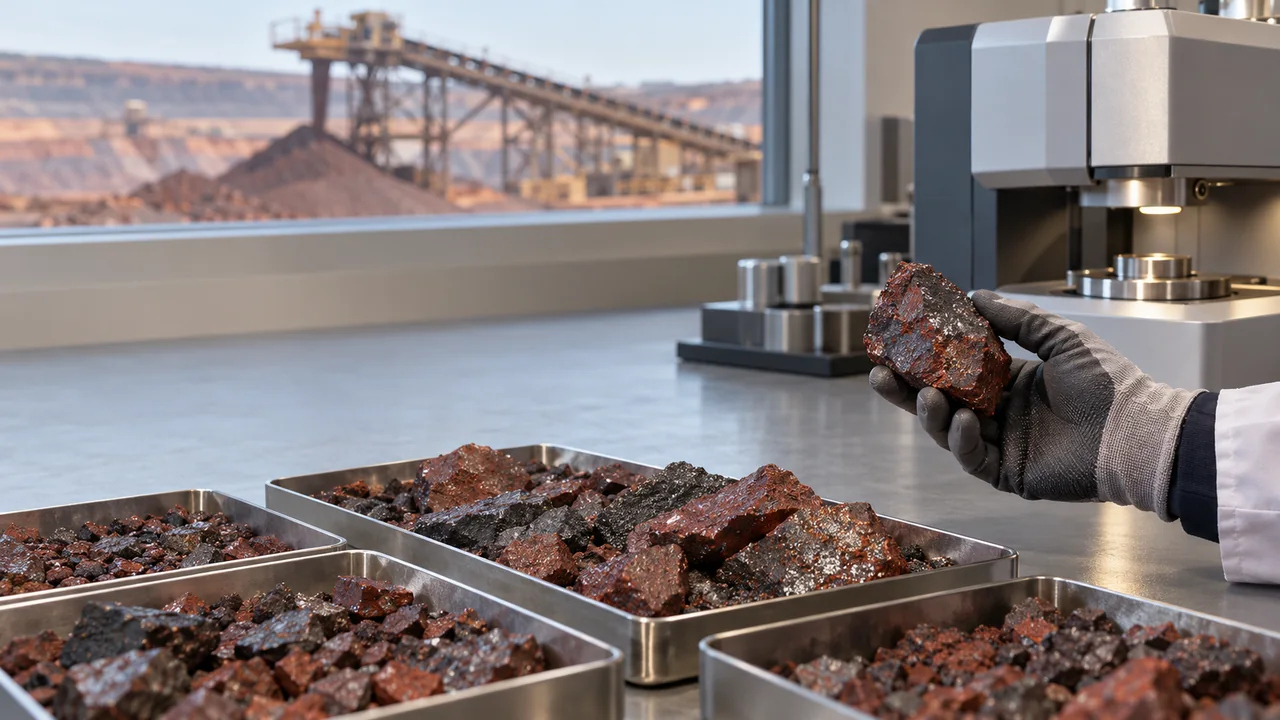
Calibrate predictions with assays; reconcile execution with production records
Account for benefits and additional costs together
Ore-flow operations graph · OreFlow Graph
The model describes the material; operational records show where it went. Connect objects, events and results so every recommendation can be traced to evidence.
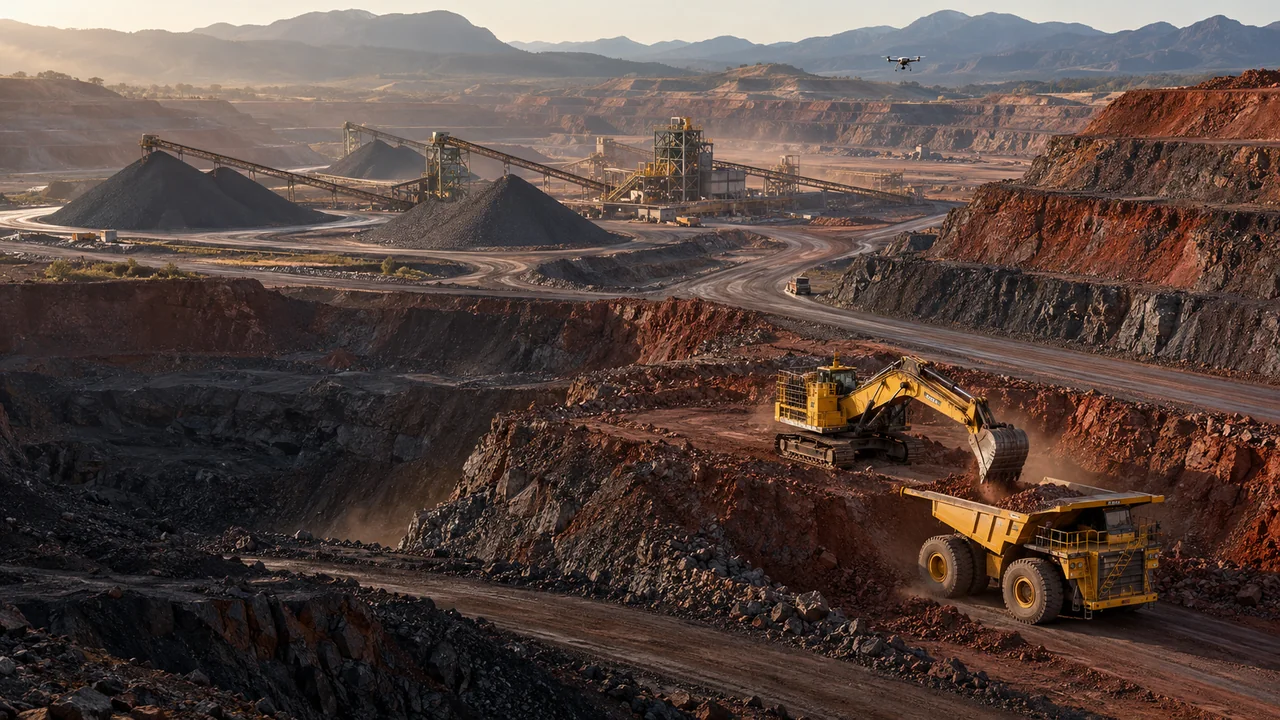
Block grade, impurities and uncertainty provide the starting point. Blasting, loading, haulage, plant feed and assays preserve material identity along the way, allowing final results to be traced back to their sources.
Drones · Frequent geometry updates
See muckpile geometry, mining-face advance and volume changes, and align the geological model with the actual site.
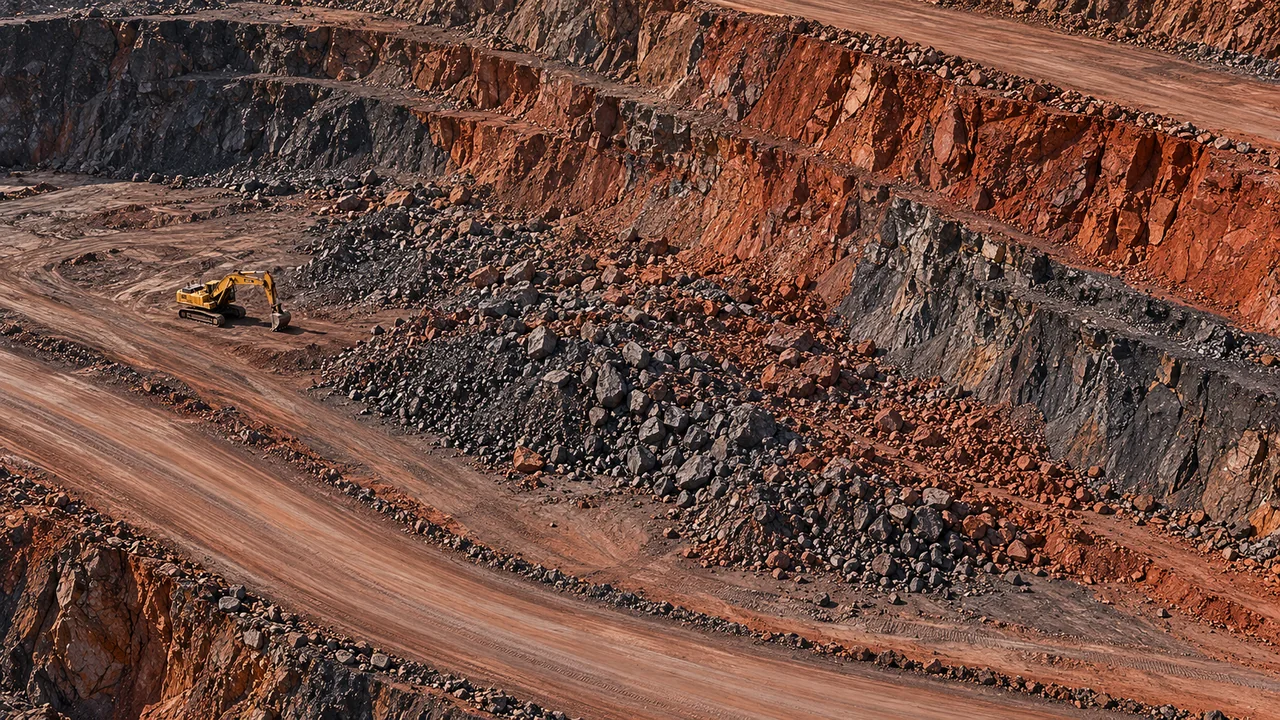
Align current terrain, model versions and blast-movement evidence in one coordinate system to review mining boundaries. Ordinary aerial imagery does not directly measure underground Fe grade; geometry updates also require registration-accuracy and error checks.
Excavators and haul trucks · Source estimation
Associate bucket positions with blocks, then calculate the mass-weighted blend. Try changing the loading share from Area A.
Predicted truckload mean. Source-matching error, geological uncertainty and measurement scale must also be considered.
Loading times, bucket trajectories, mining boundaries and weighing jointly determine confidence in material origins. Without bucket-level data, organise records by verifiable mining face or batch rather than forcing a precise source estimate.
Decisions under uncertainty
A mean alone is not enough. Greater model uncertainty makes the probability of meeting the target grade more important.
Probability of reaching 57% Fe
%Clearer sources and stronger evidence narrow the prediction distribution. Continue calibrating it against actual assays.
Thresholds and probabilities illustrate the method. Actual constraints also include impurities, recovery and processing requirements.
Truck mean μ = Σ wᵦμᵦ; variance Var(g) = wᵀΣw plus source matching error and scale error. The illustration uses a normal distribution with mean 58.3% and standard deviations of 0.65 and 1.8 percentage points respectively. Validate the distribution, correlations and parameters against actual mine data.
Selective measurement · EVSI
Would another measurement change the decision? Would the resulting value cover testing, waiting and diversion costs?
If an additional test is expected to improve decision value by CNY 900 and testing, waiting and diversion cost CNY 350, the net value of information is CNY 550. In this example, further testing may be worthwhile.
EVSI = expected best value after testing − current best value − additional cost. This example does not represent actual testing benefits. Match the sensing method to the mineral, particle size and sampling representativeness.
Specialist optimisation + Human confirmation
Recommendations must meet production constraints and be executable on site. AI organises evidence, specialist models solve the optimisation problem, and dispatchers and geologists confirm the result.

Recommended destination
Grade constraints are met and the crusher has capacity in this example. The recommendation is to send the load directly to the plant under the approved plan, reducing additional handling.
Retain input versions, decision evidence, approvers and actual unloading points. Validate interface write-back and the scope of on-site control separately.
Minimum Fe grade, maximum SiO₂, Al₂O₃ and P contents, and the probability of meeting requirements
Crusher throughput, stockpile capacity, material compatibility and the current plan
Compare ore value per tonne with testing, diversion and rehandling costs
Assay reconciliation · ROI Ledger
Use actual assays and production records to reconcile grade, tonnage and destination. Account consistently for recovered ore, diverted waste rock and additional costs.
Net value under these assumptions
¥100 tonnes × CNY 200 + 200 tonnes × CNY 80 − CNY 15,000
Illustrative assumptions: CNY 200 per dry tonne in net value from reducing ore loss and CNY 80 per dry tonne saved by diverting waste rock. The mine must confirm actual values; do not count the same benefit twice.
This demonstrates an accounting method, not a project-return forecast. Establish a baseline using comparable mining areas and shifts, controlling for prices, moisture, inventory and other technical changes.
Verify the tonnes of waste rock entering the ore stream and identify where misclassification occurred
Verify the tonnes of ore sent to waste dumps and retain material awaiting testing or a decision
Compare plant-feed assays with prediction distributions to assess whether bias and variability are decreasing
Agree the denominators, material classifications and treatment of unresolved inventory before measuring dilution and ore loss. Reconcile dry-tonne inputs, outputs and inventory changes. Validate effects through historical reconstruction, matched comparisons and controlled pilots. Improvement percentages from research illustrations are not presented as Arbor results.
Start with one mining area
Connect existing geological models, FMS, drones and assay systems. Start with verifiable data and test recommendations against real production.
01 · Historical reconstruction
Reconcile the past firstAlign models, coordinates, truck trips and assays to reconstruct material flow in one mining area and identify missing source information and misclassification.
02 · Shadow validation
Compare recommendations with current operationsRun recommendations alongside current production without changing instructions. Record when they differ, why, and the subsequent results.
03 · Controlled pilot
Expand gradually on evidenceBegin a limited pilot after human confirmation, then expand based on validation of quality, costs and interfaces.
This page presents a grade-management solution and proposed operating mechanisms for open-pit mines, not a list of delivered functions. Probability models, sensing methods, data granularity, integration, permissions and write-back capabilities depend on project assessment and validation. AI scenes, layers and interactions explain the concept; they are not customer site records.
The method draws on the supplied Grade Control Copilot strategy and ore-flow operations-graph research. Technical references include Maptek Grade Control、CSIRO mineral analysisand Palantir object and action modelling. References do not imply a partnership, complete interface compatibility or existing delivery by Arbor.